Crafting a Peer Review Process for a Distributed Team
 Joseph Caudle
on
Joseph Caudle
on
As we've written about before, DNSimple operates as an entirely distributed company. That brings many great benefits, but it also has its downsides. To address some of the menaces of the downsides (and to recognize the great things), we've been incrementally developing a practice of regular peer review to help each member of the team understand how their work is perceived by the rest of their colleagues.
In the beginning was the idea
When I joined the company, Aaron had already begun the process of discussing the kernel of this practice on the team. In fact, he'd even talked about his plans with me before I officially started at DNSimple and it was something I was looking forward to seeing implemented. On my first day, the process still hadn't been formalized, so after getting my bearings, I got to work on thinking about the process and soon started making it a reality.
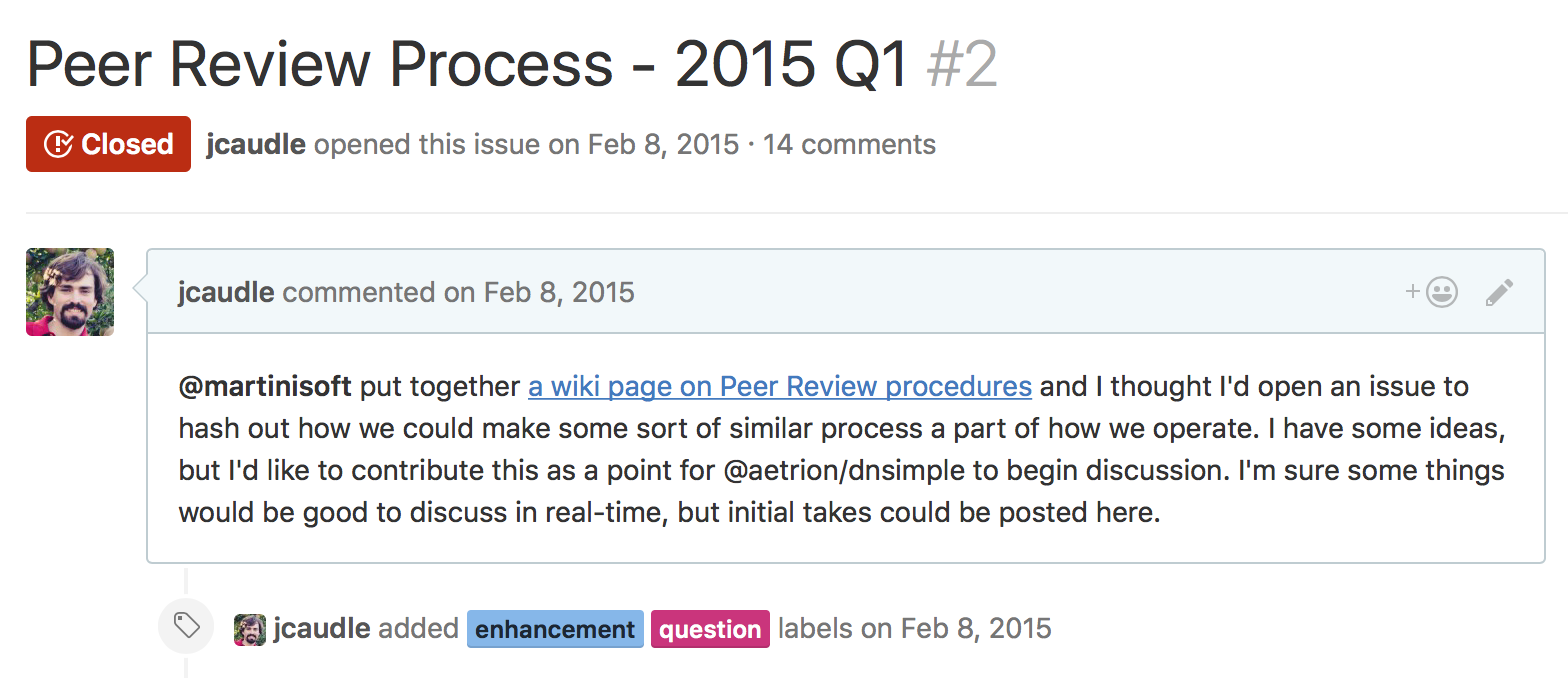
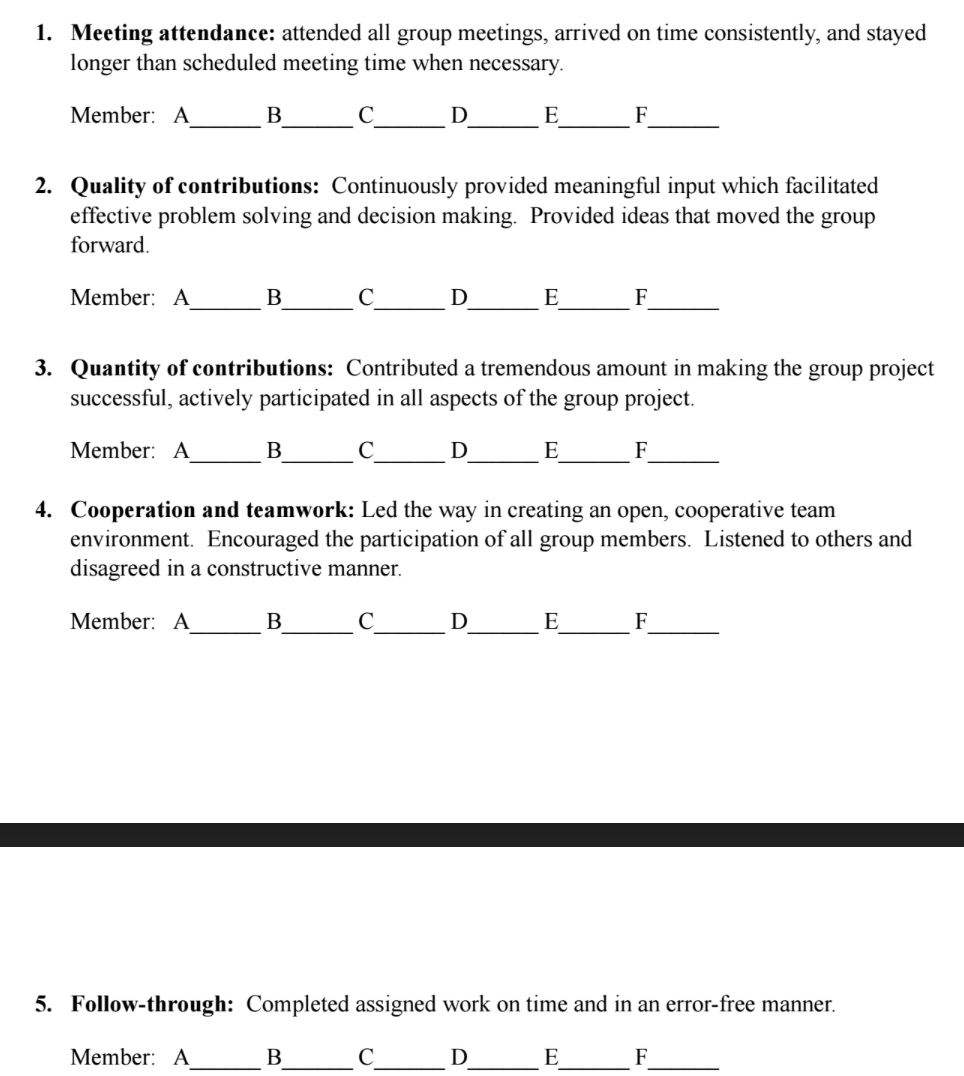
What Aaron had found was a peer review process for group projects in an academic setting that a professor had developed. It included several categories according to which each student in the group project should rate their collaborators on a 10 point scale with a description of each category.
Let there be surveys!
Obviously, working on a common set of projects is not the same as working on a school project, so we discussed how we could modify the category descriptions and started building our first survey.
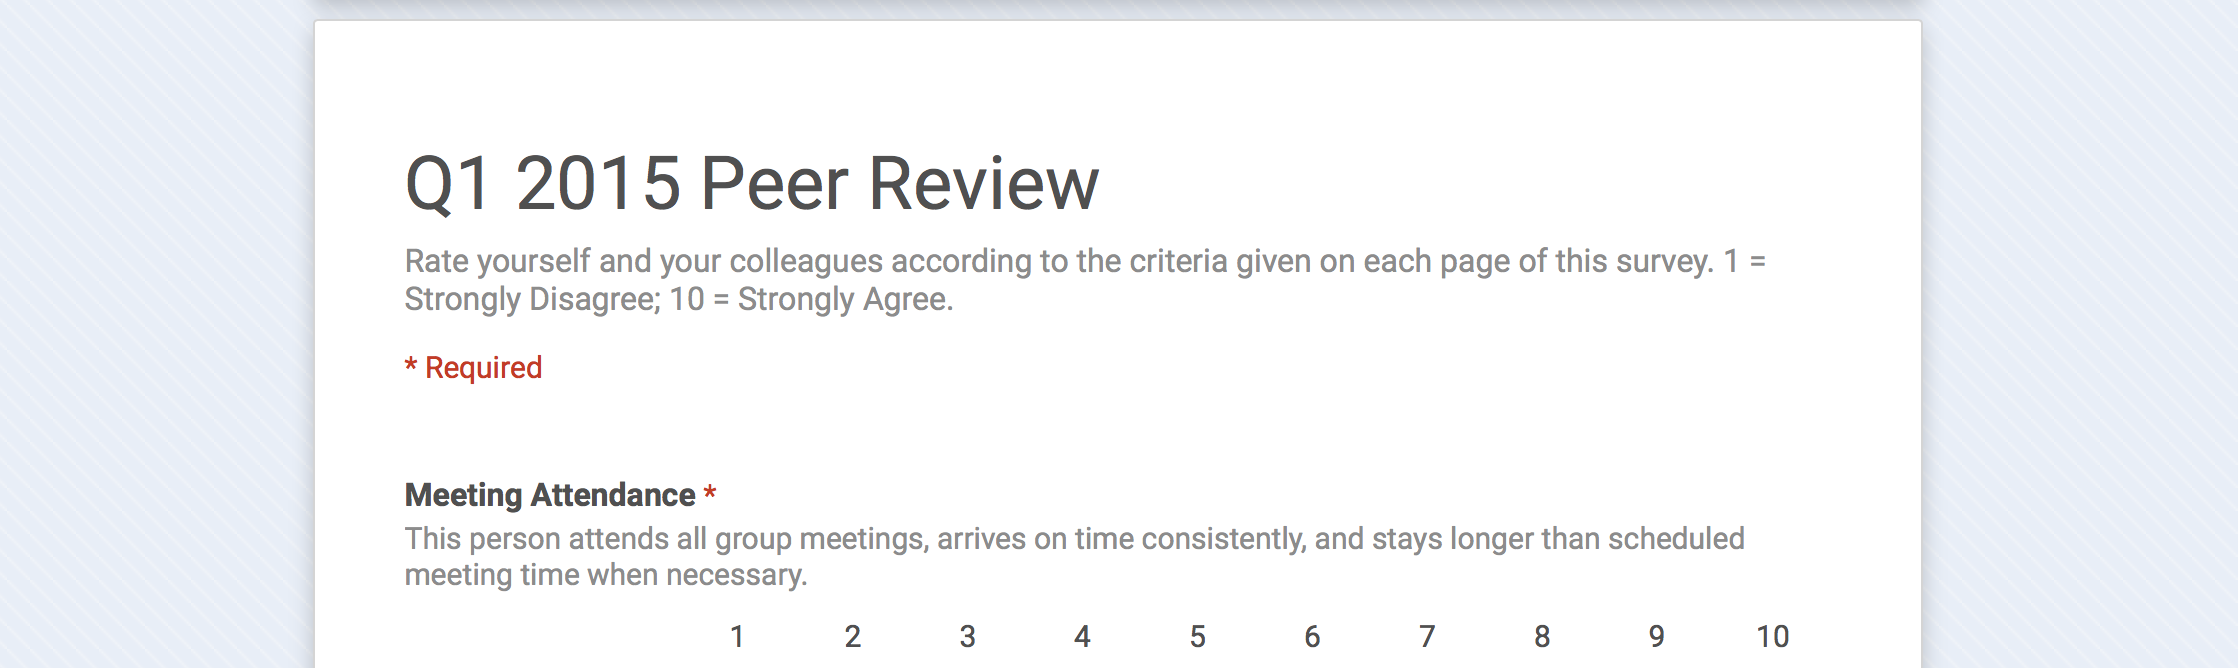
We discussed the possibility of building our own application for this system, but in the end, I threw together a Google form and sent it to the rest of the team at the end of the first quarter of 2015. I made sure that we didn't track who had submitted each response (to ensure anonymity), but also had Google ensure no more than one submission was accepted from each team member (to ensure completeness).
After we'd gotten the same number of responses as we had team members, I compiled the result spreadsheet into some more easily digestible charts and graphs. Specifically, I made a collection of I have no idea what I made the first time and then posted the results on the ticket where we'd discussed the initial survey. I also made sure to ask for feedback about the process and the results.
Incremental improvement
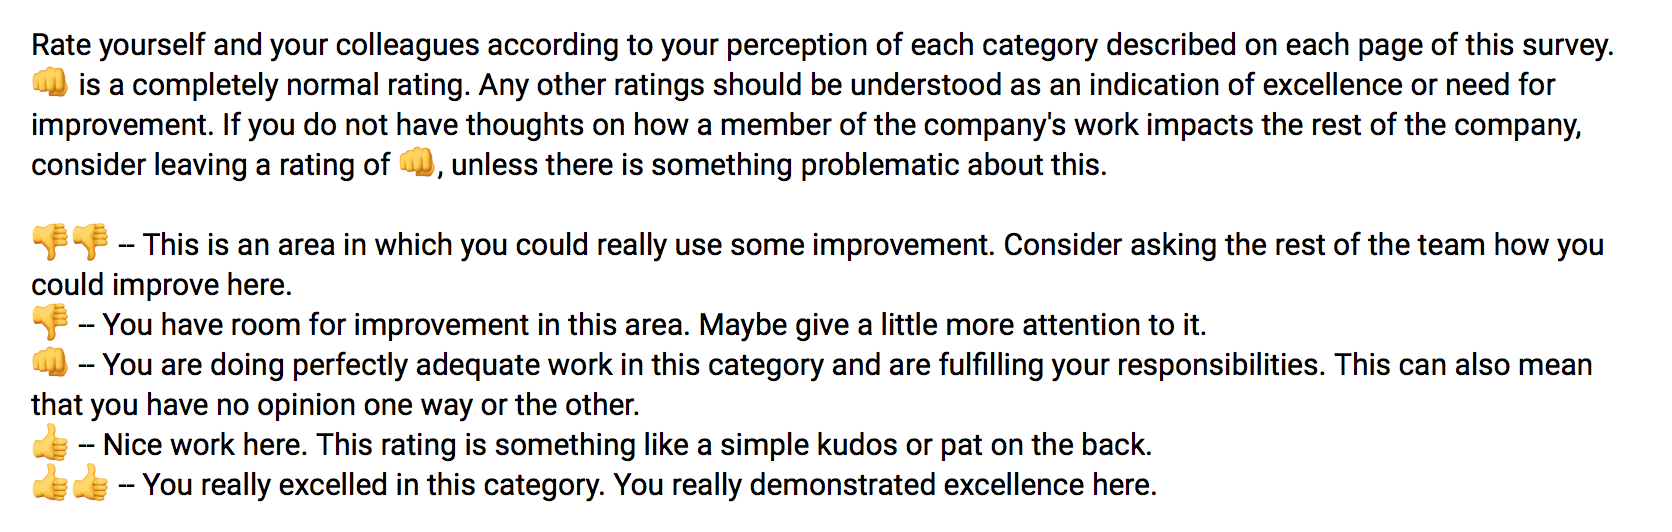
We soon realized there were things about the initial format that we wanted to change. Most prominently, the 10 point scale was mostly unused with results clustering between 7 and 10, so we introduced an emoji based scale.
We also realized the categories needed further improvements. For example, when your work is not exactly the result of group meetings, what does it mean to assess meeting attendance? Since it didn't make sense, we removed that category. Other categories received minor tweaks to their descriptions and we even introduced a new "Communication" category since we found people were using the meeting category for that.
In addition to tweaking the categories, we also have experimented with the data collection period. When you are collecting information on a quarter of your peers' work, it can be very difficult to think back across an entire quarter. Because of this, we tried an experiment of collecting data every week. This turned into a lot of work for me and an undue burden for the rest of the team, so after a few weeks of that, we fell back to monthly collection of data.
At some point, I also introduced a question about team satisfaction with the survey for that period. The reason I did this is that I noticed that we had started to see the completeness of the survey submissions slipping and I wanted to ensure it was still seen as valuable. I followed the same scale was we used on the rest of the system, and was happy to see that for the most part, we were still in good shape with team satisfaction, but it allowed us to open a good discussion about still more improvements.
After a while (and a few new teammates later), I realized that managing the spreadsheet equations could get a little complicated, so I wrote a little script to help with that. I use that script to generate the summation and averaging statistics when we add a new team member (writing this post has inspired me to share it on an internal wiki), but most of the time I can copy and paste from past months. I also made equations that translate our emoji scale into integers for easier tabulation. There are 1000 lines of that equation, so it takes a little time to copy it over, but we've got lots of room to grow before we notice a problem.
Current status
We're still carrying out these surveys on a monthly basis with a quarterly roll up of data.
The five categories we use seem to be pretty well set now also:
- Communication
- Quality of Contributions
- Quantity of Contributions
- Follow-through
- Cooperation and Teamwork
These five categories seem to sum up the things we value in the company pretty well and have allowed us to surface issues with individual contributors to the company and overcome them and also identified places where particular groups could improve aspects of their work. We've only been able to do this because we continually emphasize that this survey doesn't necessarily represent the truth of what an individual is doing on the team, but shows the perception of their contribution. This has allowed us to dig into what the reality is once we see the aggregate perception and discover the best way to address positive and negative situations.
Future plans
There are a lot of things I'd like to see happen with this system, but we are happy with the system as it works now. As I mentioned above, we've considered making an application do handle the process, but maintaining anonymity and completeness is a really hard problem that Google Forms handles nicely for us at the moment.
We also take a chance at each of our meetups to discuss the results in person. Some of these discussions can be tense, but have so far led to a much stronger team. Each team member also reviews the results in private with Anthony during regular 1-on-1's with him to see what particular lessons can be learned from the results.
Overall, we're very happy with this system and are looking forward to where things go from here.
What can you do?
If you don't presently have any sort of feedback system for your team, this might be a good system to adopt. It also might not work for you.
Our structure, much like our workplaces, is quite distributed. Zones of responsibility tend to be shared rather than hierarchically organized. We also have other practices, like blameless post-mortems, that have gotten us used to frank but blameless feedback.
If you think this system could work for you, I advise you to discuss the practices that you might want to adopt for your team. If you have suggestions from systems you've tried, we'd love to hear about them!
In any case, if you have the authority or ability, make sure your team is able to know how they can improve and where they've been shining. It has helped us with morale, cohesion, and collaboration and hopefully it will continue to do so. We'd love it if this inspires the same for you!
Joseph Caudle
Teacher of people and computers. Fond of subtle distinctions.
We think domain management should be easy.
That's why we continue building DNSimple.