A Late Answer Is a Wrong Answer: Heaps, Continuations and ETS on the BEAM
 Nelson Vides
on
Did you know that a correct DNS answer that arrives too late is still a wrong answer? Let's dive into the complexity of DNS wearing our Erlang-hat.
In Making dns_erlang Fast, we made our DNS library cheaper to run, and it now accounts for only about 9% of busy CPU in production. So where does the rest of the time go? This post follows a query through the next layer, erldns, our open-source authoritative DNS server, from the moment it's decoded to the moment its answer is sent.
One idea runs through all of it. The BEAM is built to get all the work done eventually. Mailboxes grow as long as they need to, the scheduler is fair to every process, and nothing is dropped unless you drop it yourself. That's the right default for most systems, and a big part of why Erlang and Elixir services are so robust.
A DNS server lives by a different rule. If a resolver doesn't hear back from us quickly, it gives up and asks another name server, and our answer is never read. The CPU we spent producing it is wasted. Worse, we took that CPU from the queries that were still on time.
Each section below is one place where we bent a BEAM default toward answering sooner.
Note
Deciding how much work to accept in the first place, with CoDel and CUBIC, was the subject of our erldns v10 post. Here we look at what each accepted query costs, and how long it waits.
The zone cache: find, don't count
Let's start with a story from production. For the first months of this year, our name servers kept getting busier while the traffic they answered stayed flat. Every week, they needed a little more CPU for the same number of queries. Finding the cause was fun, and in hindsight, it was so obvious.
Every query ends up in the zone cache, the set of ETS tables that holds every zone and record we serve. Our ENT compliance post explained how records are keyed: by their labels, reversed, in an ordered_set. That layout lets a lookup with a partially bound key visit only the matching range of the table, instead of scanning the whole thing. The work since then has been about doing as little as possible inside that range.
To answer correctly, the server keeps asking the cache yes-or-no questions: does this name exist? Does anything exist below it? We used to answer them by counting:
%% Before: count every matching record, then compare with zero.
0 =/= ets:select_count(erldns_zone_records_typed, [{{{Zone, Labels, '_'}, '_'}, [], [true]}]).

%% After: stop at the first match.
case ets:select(erldns_zone_records_typed, [{{{Zone, Labels, '_'}, '_'}, [], [true]}], 1) of
    {[true], _Continuation} -> true;
    '$end_of_table' -> false
end.
A count has to visit every match before it can answer. For a name with five record types, that's five visits instead of one. For "does anything exist below this name?", the higher the name sits in a zone, the more there is to count, and near the top of a large zone that means a large part of the zone, all visited to answer a yes that the very first entry already gave. Since #333, ets:select/3 with a limit of 1 stops at the first match. The same pull request also classifies a name (exact match, wildcard, empty non-terminal or nonexistent) in a single walk of the tree, where the old code could take two.
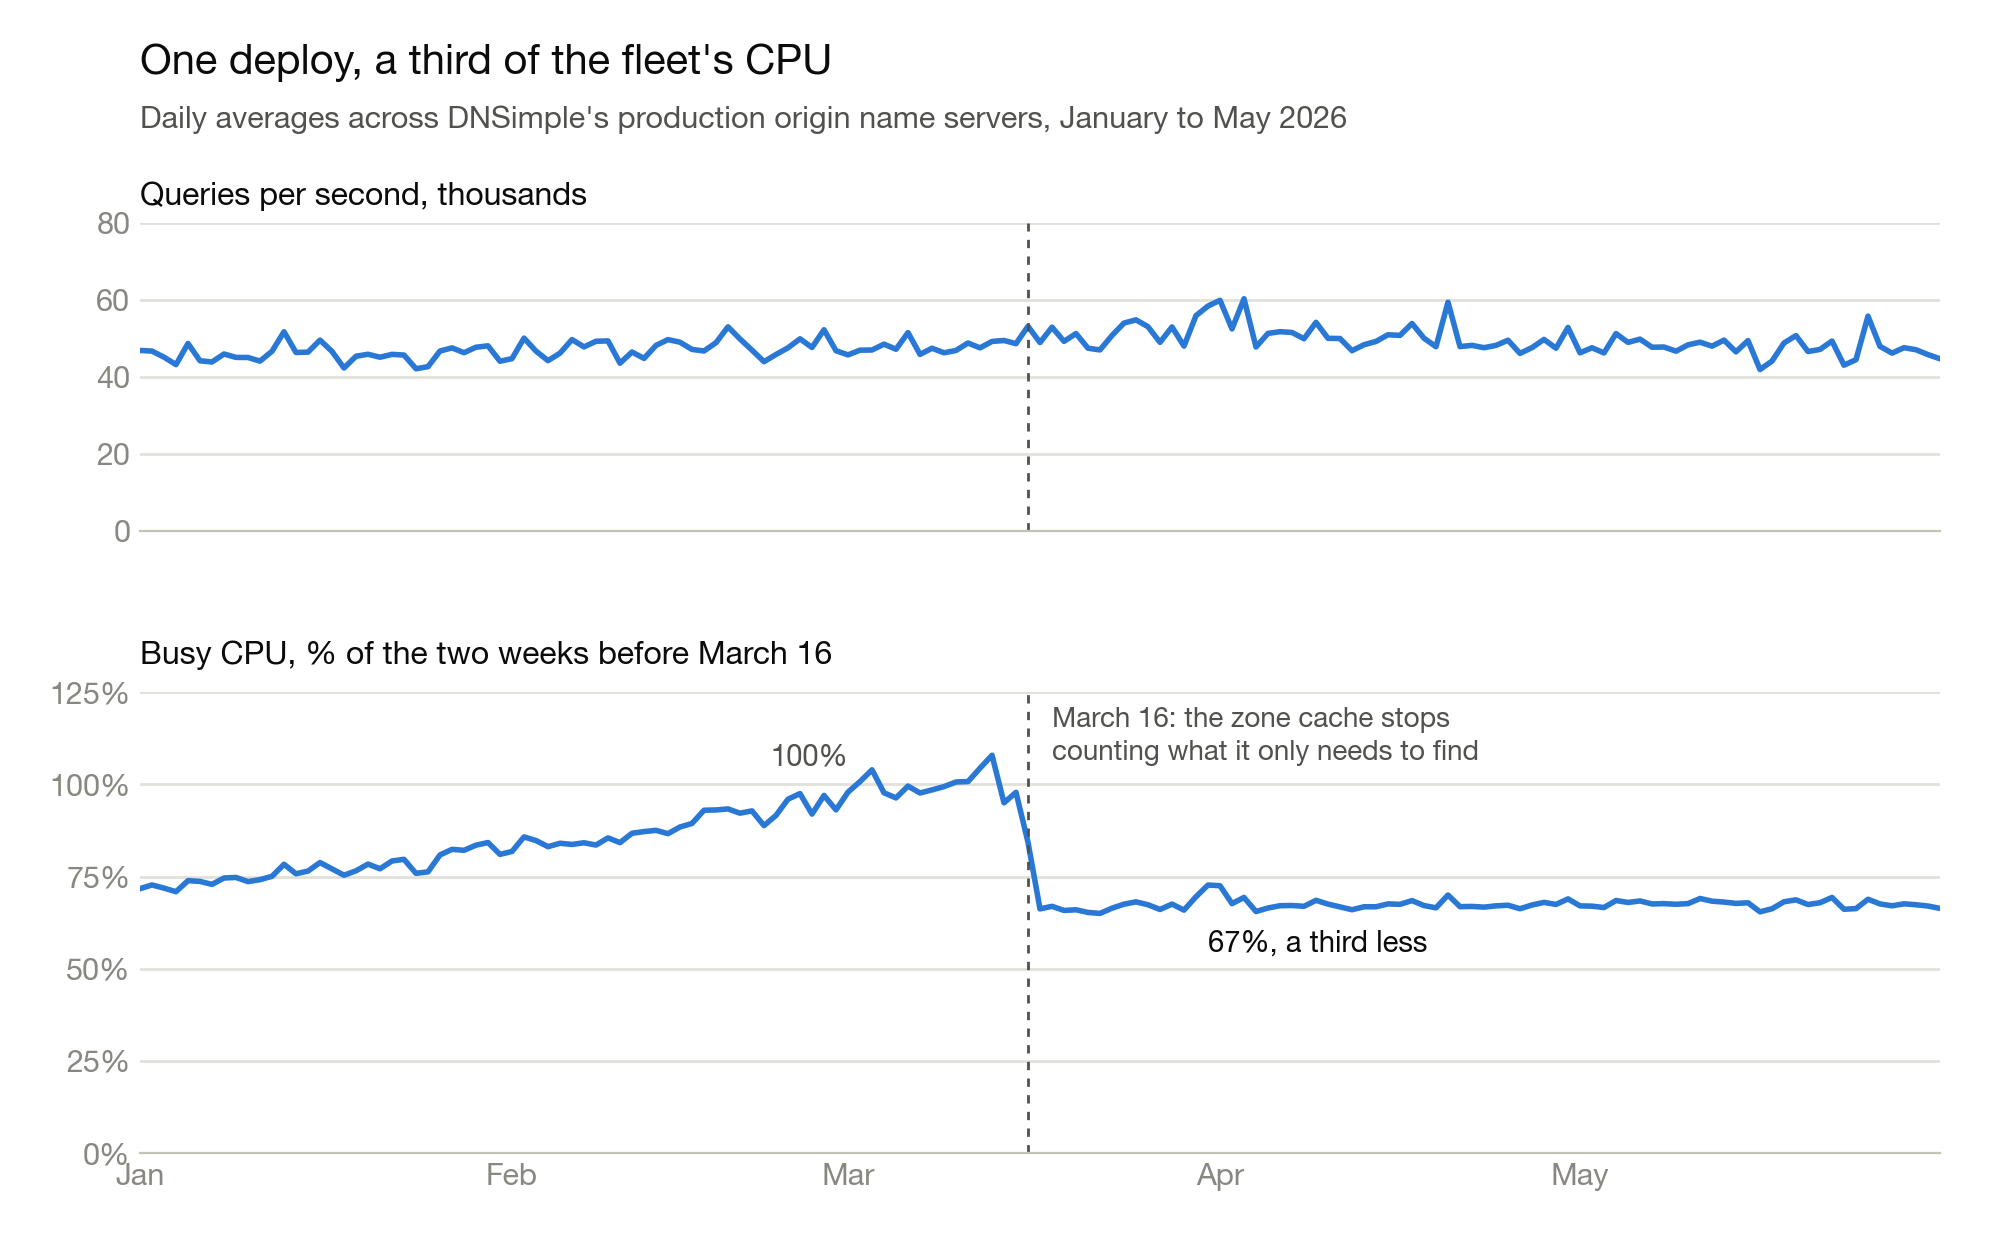
The deploy went out on March 16. Comparing the two weeks after it with the two weeks before, our origin name servers used a third less CPU, while traffic grew by 6%. The creep in the weeks before was the giveaway: a cost that grows with the size of the zones, and not with the number of queries, looks exactly like that.
We kept pulling on that thread. A select/3 with a limit still compiles a match spec, runs it and frees it on every call, and for a question this small, that's a good part of the cost. "Does this name exist?" and "does anything exist below it?" were also still two questions, asked with two selects. But the table is an ordered_set, and Erlang's term order already puts both answers in one place: a name's own rows sort together, by type, and the rows of every name below it come right after them, because a list sorts right after any of its prefixes. So in #380, both questions became a single step to the next key:
classify(Gen, Labels) ->
    case ets:next(erldns_zone_records_typed, {Gen, Labels, -1}) of
        {Gen, Labels, _} ->
            exact;
        {Gen, Below, _} when is_list(Below) ->
            case lists:prefix(Labels, Below) of
                true -> ent;
                false -> none
            end;
        _ ->
            none
    end.
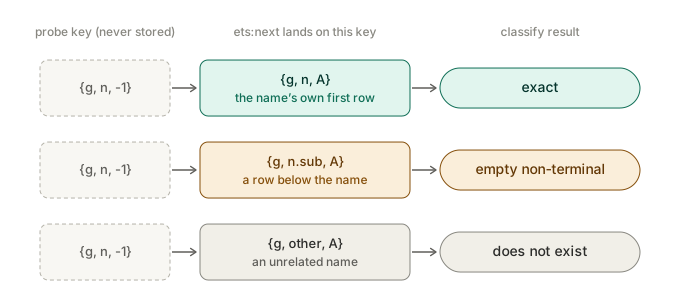
No record type is negative, so {Gen, Labels, -1} is never in the table, and it sorts before every row of the name. The key right after it is one of the name's own rows if it has any, and the name exists. Otherwise, it's a row of some name below it if there is one, and the name is an empty non-terminal. Otherwise, it belongs to some other name, and this one doesn't exist. That's one descent of the tree, no match spec, and nothing copied but a key. In a production profile, the helper it replaced took almost 6% of the busy CPU time, more than a third of that just compiling and freeing match specs, and against the previous version, an NXDOMAIN answer from the cache got 1.8 times faster.
Give every query the heap it needs
Every Erlang process starts with a small heap of 233 words (1864 bytes on a 64-bit machine). When it fills up, the process runs a garbage collection, and if the live data still doesn't fit, the heap grows to the next size in a Fibonacci-like sequence: 376, 610, 987, 1598 words, and so on. For a long-lived process, that's a fine way to find the right size over time. For a process that lives for a single DNS query, it means paying for several garbage collections and heap expansions before the query is answered, every single time.
To see how bad it was, we traced the garbage_collection events of a process resolving example.com A, one of the cheapest queries we answer, while varying the starting heap size with the min_heap_size spawn option. The median of 500 runs per size:
min_heap_size (words) |
Minor GCs | Major GCs | Heap expansions | Time |
|---|---|---|---|---|
| 233 (the default) | 5 | 4 | 9 | 66 µs |
| 600 | 1 | 1 | 2 | 53 µs |
| 700 | 0 | 0 | 0 | 29 µs |
| 1000 | 0 | 0 | 0 | 25 µs |
A query like this one allocates a bit more than 610 words in total, so a process that starts any smaller has to collect garbage and grow its heap before it can answer. Once it doesn't have to, the same work takes less than half the time. Note, before it surprises you, that the BEAM rounds min_heap_size up to the next size in that same sequence. You can check it in a shell:
1> P = spawn_opt(fun() -> receive _ -> ok end end, [{min_heap_size, 650}]).
2> process_info(P, heap_size).
{heap_size,987}
So 650 and 700 give you exactly the same heap: 987 words. We settled on 650 in #306, for both the process that serves each TCP request and the long-lived workers that serve UDP, where it acts as a floor: after a collection, their heap never shrinks below what a query needs.
The catch is memory: about 8 KB per process instead of about 2 KB. For a few thousand concurrent requests that's nothing, but it's worth doing the multiplication for your own concurrency before raising it.
This applies far beyond DNS. If your system spawns a process per request (Bandit and Cowboy do, and therefore so does Phoenix on any of them), per job or per message, that process probably starts too small, collects garbage several times, and dies. Measure what it actually needs, and give it that from the start, latency might appreciate it.
Never make a worker wait
UDP queries in erldns are answered by a pool of long-lived worker processes. Acceptors read packets from the socket and hand each one to a worker, which works through its mailbox one query at a time. Most queries are answered entirely from memory, in microseconds.
Some are not. Our ALIAS records point a domain to another hostname, and answering one means asking another DNS server for that hostname's addresses at query time. If a worker blocks on that lookup, every query queued in its mailbox waits too, even the ones that would have taken microseconds. The throughput instinct is to add more workers, but more workers only make it less likely, not impossible, that a query lands behind a slow one.
So in #327 we created the infrastructure for a worker to never wait. In erldns, each query flows through a pipeline, which is simply a list of functions applied one after another (we call them pipes, it's a Plug-inspired architecture if you're familiar with it). A pipe that needs to do something slow can now return {suspend, Msg, Opts, AsyncFun} instead of an answer, and the pipeline turns the rest of its own work into data:
{suspend, Msg1, Opts1, AsyncFun} when is_function(AsyncFun, 2) ->
    {suspend, #continuation{message = Msg1, opts = Opts1, pipeline = [AsyncFun | Pipes]}};
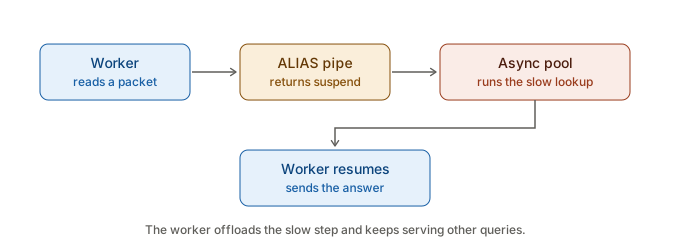
The continuation is just the remaining pipeline, with the slow step pushed on top. The worker casts it to a separate, bounded pool (four processes per scheduler by default) and immediately moves on to the next packet. A pool process runs the slow step, then casts the continuation back to the worker that started it, which runs the remaining pipes and sends the answer. Over TCP, where every request already has a process of its own, nobody is queued behind it, so the continuation simply runs in place.
Now for the twist. The continuation carries the query's original arrival time, and it is checked against CoDel at every hop: when the worker first picks up the query, when the pool picks up the continuation, and when the worker picks it up again to finish it. If an ALIAS lookup took too long, CoDel learns about it, and it takes it into consideration for a potential queue cleaning.
Dropping itself has to be cheap, because it happens exactly when the server is busiest. When CoDel starts dropping, the worker stops going back through the gen_server loop for every message, and drains its mailbox with a plain receive instead:
drop_loop(Codel, Budget) ->
    receive
        {'$gen_cast', {udp_work, Socket, IpAddr, Port, IngressTs, Bin}} ->
            process_udp_work(Codel, Socket, IpAddr, Port, IngressTs, Bin, Budget - 1);
        {'$gen_cast', {async_done, Continuation}} ->
            process_async_continuation(Codel, Continuation, Budget - 1)
    after 0 ->
        {noreply, Codel}
    end.
The budget (500 messages) makes it return to the gen_server loop regularly anyway, so system messages, like code upgrades or debugging requests, are never starved. Matching on '$gen_cast' relies on how gen_server wraps its messages, so it's a trick to use sparingly, in the one loop where it pays off.
We're in good company, though: OTP's own logger does the same thing when a handler falls behind. Once the handler's queue passes flush_qlen (1000 messages by default), logger_olp raises its own priority and drains up to 5000 log events in a raw receive, matching the '$gen_cast' and '$gen_call' wrappers directly and leaving every other message where it is. The difference is what happens to each message. The logger discards its log events unread, while our loop still asks CoDel about every query, so one that is still fresh gets its answer.
We learned one more lesson in production, in September (5bbe847). The pool used worker_pool's overrun protection, which kills a worker that runs for too long. But when a worker is killed, every continuation queued in its mailbox dies with it, silently: no answer, no drop, no metric. The suspending pipes already bound their own work with timeouts, and CoDel already sheds load whenever a worker's queue gets stuck, reporting each drop on a telemetry event. So we removed the kill. If you build for latency, you will drop work; make sure it happens in just one place, and that the place tells you about it.
Swap a zone, don't rebuild it
The last change is about correctness more than speed, but it's our favourite ETS pattern, so it earns its place. Production replaces whole zones all the time, some of them with 170 thousand names, dozens of times a day on every name server. The old code published the new zone, deleted every record of the old one, and inserted the new records one at a time. For the tiny amount of time that took, a query for a name that existed in both versions could be answered NXDOMAIN, and that tiny amount of time became an eternity of errors.
Since #377, records are keyed by a generation number instead of by their zone. A new version of a zone is written under a fresh generation that no lookup can reach yet. When it's complete, it goes live by swapping in a zone header that names it, with a compare-and-swap built on ets:select_replace/2:
replace_zone(#zone{labels = ZoneLabels, gen = Gen}, Updated) ->
    MatchSpec = [{match_zone(ZoneLabels, Gen), [], [{const, Updated}]}],
    1 =:= ets:select_replace(erldns_zones_table, MatchSpec).
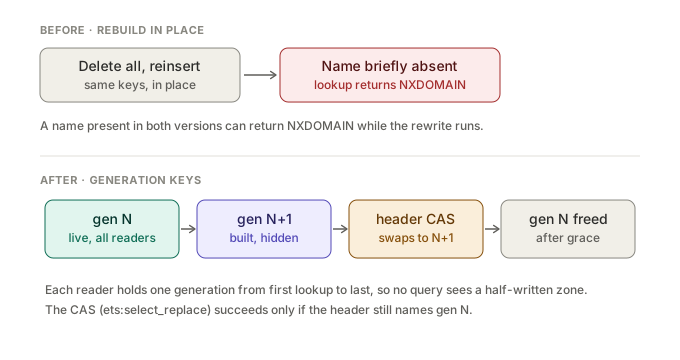
The swap only succeeds if the header still names the generation it was read with, so two writers racing each other can't point the zone back at records that are being retired. Every query reads the zone's generation from the header once, so it sees one version of the zone from start to finish. The old generation stays readable for a grace period, so that queries already holding the old header can finish, and is deleted afterwards. Readers never lock and never wait, and nobody sees a half-written zone. If you know read-copy-update from the Linux kernel, this is the same idea, built from nothing but ETS. The kernel's own example publishes a new copy with rcu_assign_pointer() and hands the old one to call_rcu(), to be freed once a grace period has passed.
And although this change was about correctness, it made lookups faster too. An ordered_set compares keys at every step down its tree, and every record key used to start with the zone's name: a list of labels, compared one binary at a time, and the same for every record in the zone, so each comparison had to get through all of it before reaching the part that differs. A generation is a small integer, compared in a single step. In a synthetic benchmark with 860 thousand records across 20 thousand zones, a lookup took between a fifth and a half less time, and the most when queries kept to a few hundred zones.
What's next
When we started writing this post, the zone cache was the biggest single piece of a production profile, at about a third of the busy CPU time, much of it spent comparing keys inside ETS. With generation keys and classify/2, the same measurement on the same name server now puts it at about a sixth.
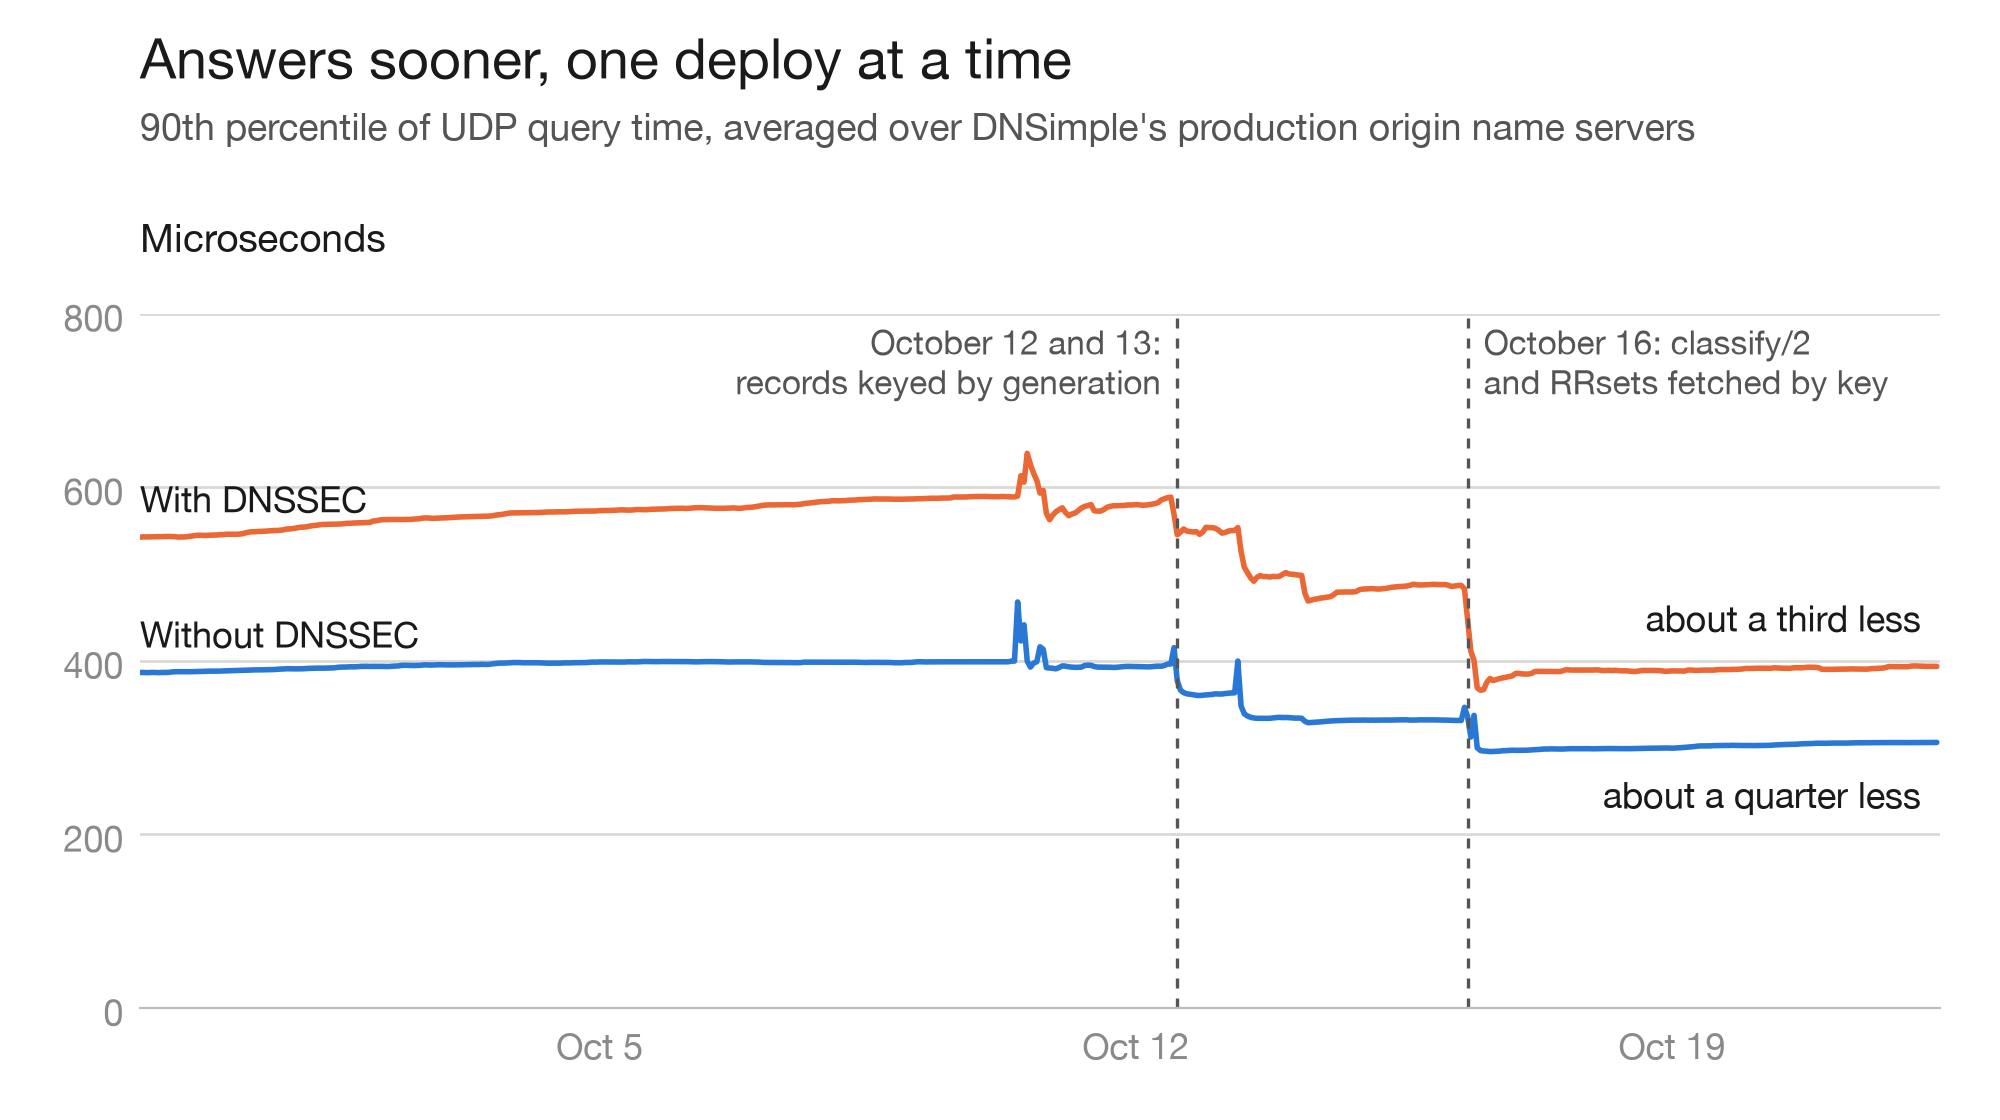
Production answers sooner for it, too. Across our origin name servers, the time within which nine in ten queries are answered dropped by about a quarter, and by about a third for queries that ask for DNSSEC, one step with each deploy:
Some of what's left is ours to do, and some of it may belong in ETS itself. We're looking at both.
What this means for DNSimple customers
Answering sooner is the whole point. A query that never waits behind a slow one, and a server that sheds load when it falls behind instead of answering late, mean faster answers for your domains, especially when things get busy. The CPU we got back is headroom: more room to absorb traffic spikes and attacks before load shedding has to kick in. And with atomic zone swaps, your records keep resolving while your zone is being replaced, however big it is.
erldns is open source and available on GitHub. If you run anything latency-sensitive on the BEAM, we hope some of these patterns find their way into your code.
If you have questions about erldns, dns_erlang or DNSimple's infrastructure, get in touch. We love talking about this stuff.
At DNSimple, we’d rather drop a late answer than send a wrong one. If you’d like your domains answered by the code in this post, try DNSimple free for 30 days.
Nelson Vides
Nameserver Sensei
We think domain management should be easy.
That's why we continue building DNSimple.